LoonieWallet Team · Investment · Last verified
XEQT vs VEQT: The Actual Differences, in Numbers
Same idea, same fee, nearly identical returns. What differs is how much Canada they hold, how often they pay out, and a few basis points of MER that are still shrinking. The verified figures, side by side, and a way to decide that does not involve a coin.
XEQT and VEQT are the two largest all-equity portfolio ETFs in Canada, and they are close enough that people spend far too long choosing. Here is everything that differs between them as of 2026-09-18, from the issuers’ own documents, and then a short way to decide.
Side by side
| XEQT (iShares) | VEQT (Vanguard) | |
|---|---|---|
| Management fee | 0.17% (cut from 0.18% on Dec 18, 2025) | 0.17% (cut from 0.22% on Nov 18, 2025) |
| Reported MER | 0.19% (fact sheet, Aug 2026); 0.20% in the June 2026 ETF Facts | 0.22% (as of Mar 31, 2026) |
| Net assets | $22.1 billion (2026-08-31) | $17.0 billion (2026-08-31) |
| Underlying stocks | 8,272 | 13,721 |
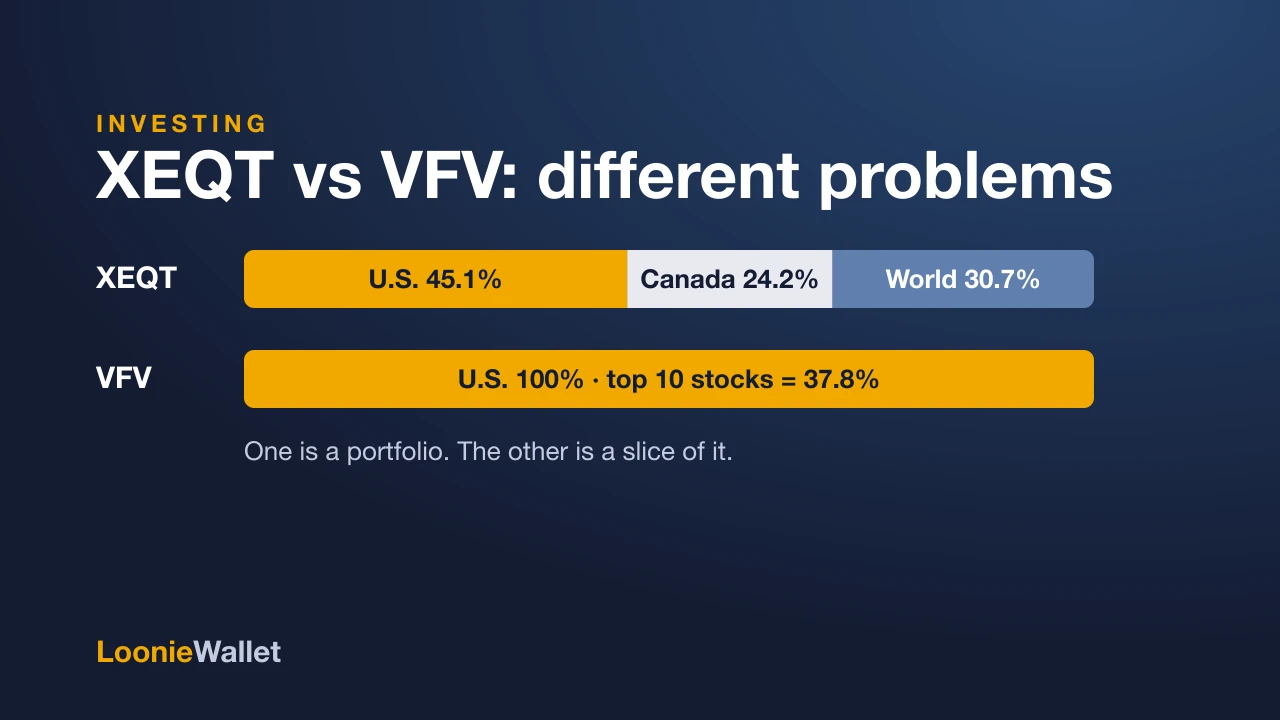
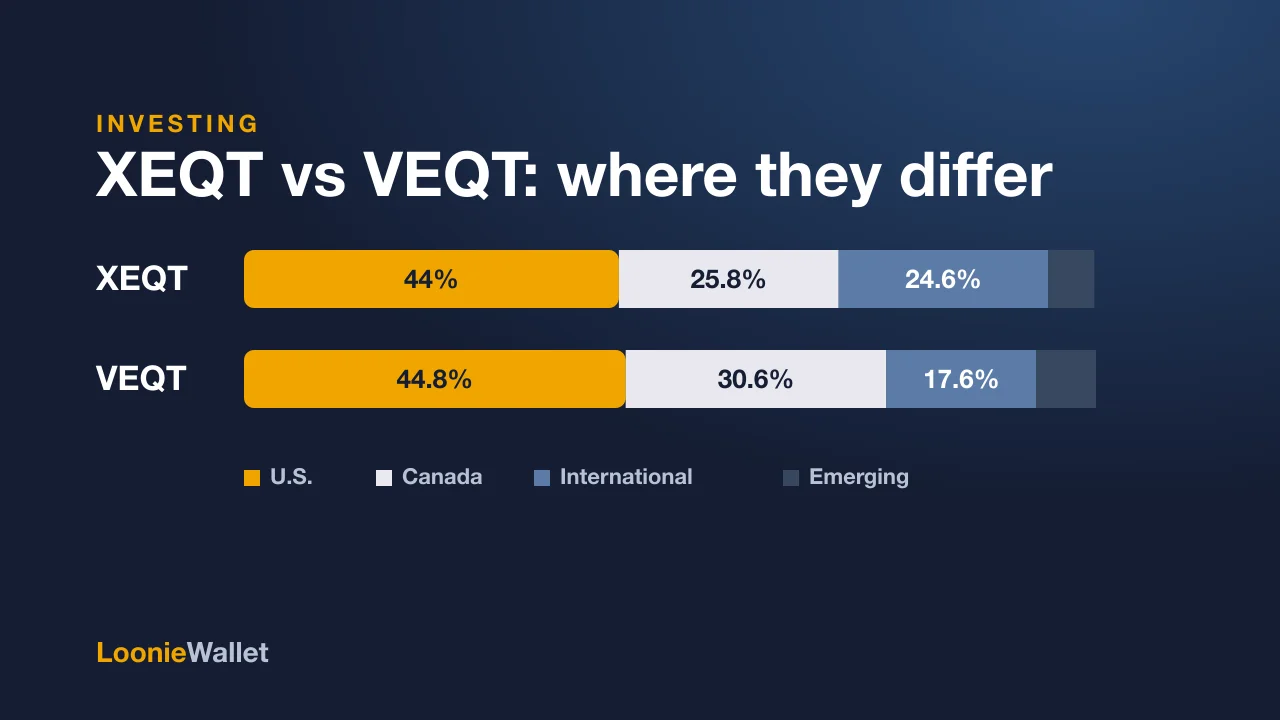
| United States | 45.1% | 44.8% |
| Canada | 24.2% | 30.6% |
| Developed international | 24.6% | 17.6% |
| Emerging markets | 5.4% | 7.0% |
| Distributions | Quarterly; trailing yield 1.57% | Annually |
| Launched | 2019-08-07 | 2019-01-29 |
| Listed | TSX, Canadian dollars | TSX, Canadian dollars |
XEQT regional weights are from the August 2026 fact sheet (geographic breakdown) and the June 2026 ETF Facts (investment mix); VEQT weights are from the August 31, 2026 fact sheet.
What is inside each
Both are funds of funds. XEQT holds five iShares ETFs; VEQT holds four Vanguard ETFs. The one structural quirk worth knowing: XEQT reaches U.S. stocks through both a U.S.-listed ETF (ITOT) and a Canadian-listed one (XUU), while VEQT uses a single Canadian-listed U.S. fund (VUN). Neither structure changes the tax outcome for you, as covered below.
XEQT holdings (2026-08-31)
- 29.7% iShares Core S&P Total U.S. Stock Market ETF (ITOT, U.S.-listed)
- 25.6% iShares Core S&P/TSX Capped Composite Index ETF (XIC)
- 24.4% iShares Core MSCI EAFE IMI Index ETF (XEF)
- 15.3% iShares Core S&P Total U.S. Stock Market Index ETF (XUU)
- 4.8% iShares Core MSCI Emerging Markets IMI Index ETF (XEC)
VEQT holdings (2026-08-31)
- 44.8% Vanguard U.S. Total Market Index ETF (VUN)
- 30.6% Vanguard FTSE Canada All Cap Index ETF (VCN)
- 17.6% Vanguard FTSE Developed All Cap ex North America Index ETF (VIU)
- 7.0% Vanguard FTSE Emerging Markets All Cap Index ETF (VEE)
The index families differ (S&P and MSCI at iShares; CRSP-style total market and FTSE at Vanguard), which is why VEQT reports more underlying stocks: FTSE’s all-cap indexes reach further into small caps. In practice the overlap in what moves the funds is near total. The performance table shows it.
The one real difference: how much Canada
XEQT holds about 24% Canadian stocks; VEQT about 31%. That six-point gap comes out of the U.S. weight (45% versus 45%).
Both are far above Canada’s roughly 3% share of world markets, and both issuers do it deliberately: Canadian stocks pay eligible dividends that are taxed favourably in a taxable account, carry no foreign withholding tax, and remove currency risk from part of the portfolio. Vanguard leans harder into those arguments; iShares leans closer to global market weights.
Which is better depends on a question nobody can answer in advance: whether Canadian stocks, which are concentrated in banks, energy and materials, outperform the U.S. over your holding period. If you believe the U.S. market’s technology weight is overpriced, VEQT’s extra Canada is a mild hedge. If you think Canada’s market is too narrow to overweight, XEQT is closer to the world. The difference in outcomes over five years has been negligible, as the next section shows, because both weights are still dominated by the same U.S. giants.
Performance, year by year
Same idea, near-identical results. Returns are calendar-year total returns from each issuer’s documents, after fees, in Canadian dollars.
| Year | XEQT | VEQT | Gap |
|---|---|---|---|
| 2021 | 19.57% | 19.66% | -0.09 pts |
| 2022 | -10.93% | -10.92% | -0.01 pts |
| 2023 | 17.05% | 16.95% | 0.10 pts |
| 2024 | 24.67% | 24.87% | -0.20 pts |
| 2025 | 20.45% | 20.45% | 0.00 pts |
| 2021 to 2025, cumulative | 87.2% | 87.5% | -0.30 pts |
Five years, both funds within a fraction of a point of each other every single year, and the same 20.45% in 2025. Past returns say nothing about future ones, but they do say the two funds are the same bet.
Fees, in dollars
The reported MER gap is 3 basis points and is closing: both issuers cut management fees to 0.17% in late 2025, and the MERs reported today still include months at the old fees. Here is what the current gap costs.
What the MER gap costs in dollars
XEQT ending value
VEQT ending value
Difference
On $25,000 plus $500 a month for 25 years at 6%, the gap is a few hundred dollars on a portfolio of several hundred thousand. Worth knowing; not worth switching a taxable account and triggering capital gains to capture.
Distributions and taxes
Frequency. XEQT pays quarterly; VEQT pays once a year. Inside a TFSA, RRSP or FHSA this changes nothing except when the cash lands. In a taxable account you pay the same tax either way; the quarterly payer just spreads it out.
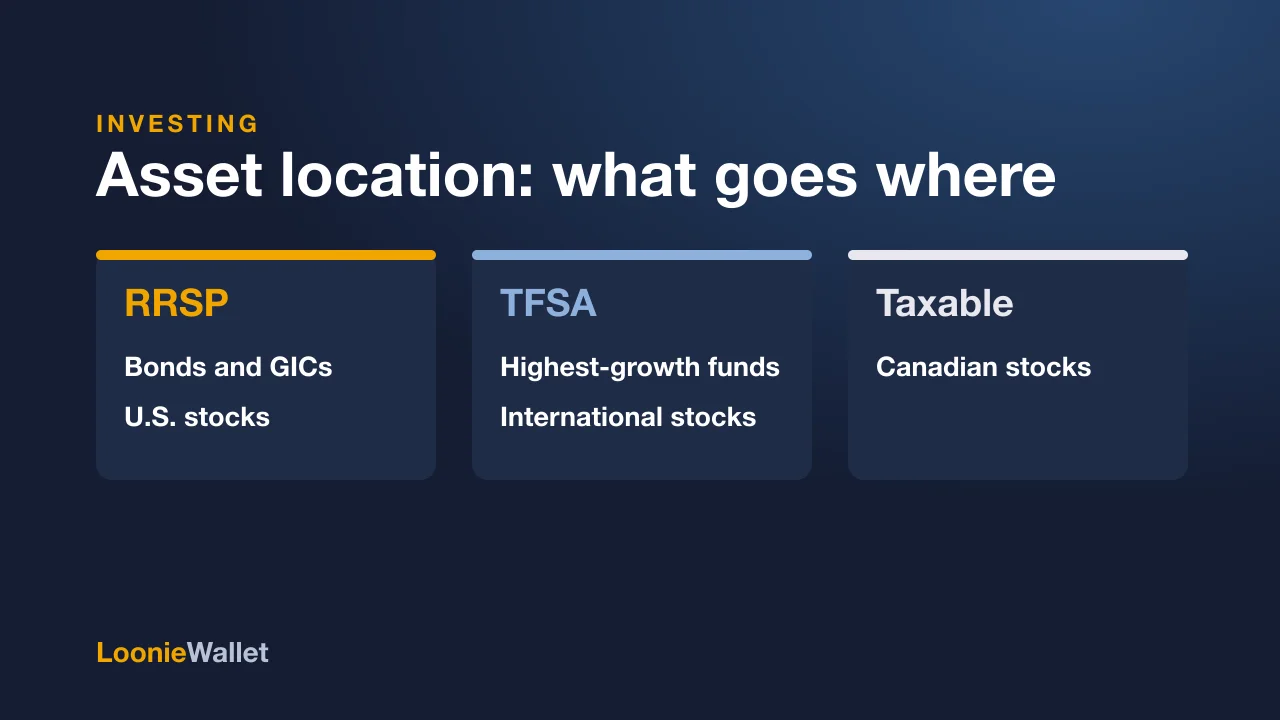
Foreign withholding tax. Both funds hold U.S. and international stocks through Canadian-listed wrappers (XEQT’s ITOT sleeve is U.S.-listed, but it sits inside a Canadian fund, which is what matters). Per the iShares reference guide, that means the 15% U.S. treaty withholding applies inside both funds in every account, unrecoverable in a TFSA or RRSP, generally creditable in a taxable account. International dividends are withheld at their source countries (a weighted average of about 10.49% across MSCI EAFE, per BlackRock) on the same basis. The treatment is identical for the two funds, so it does not help you choose between them. It is only a reason to consider U.S.-listed ETFs directly in an RRSP, which the asset location guide weighs.
Turnover. Both rebalance internally. Neither has historically distributed large capital gains, but that is a fact about the past, not a promise.
How to decide in one minute
- Already own one? Keep it. The gap does not justify a switch, and in a taxable account a switch is a taxable sale.
- Want less Canada? XEQT (24%). Want more? VEQT (31%). If you have no view, that is fine; the outcome difference has been tiny.
- Prefer fewer distributions to track in a taxable account? VEQT pays once a year.
- Prefer the lower reported MER today? XEQT, by a handful of basis points that are shrinking.
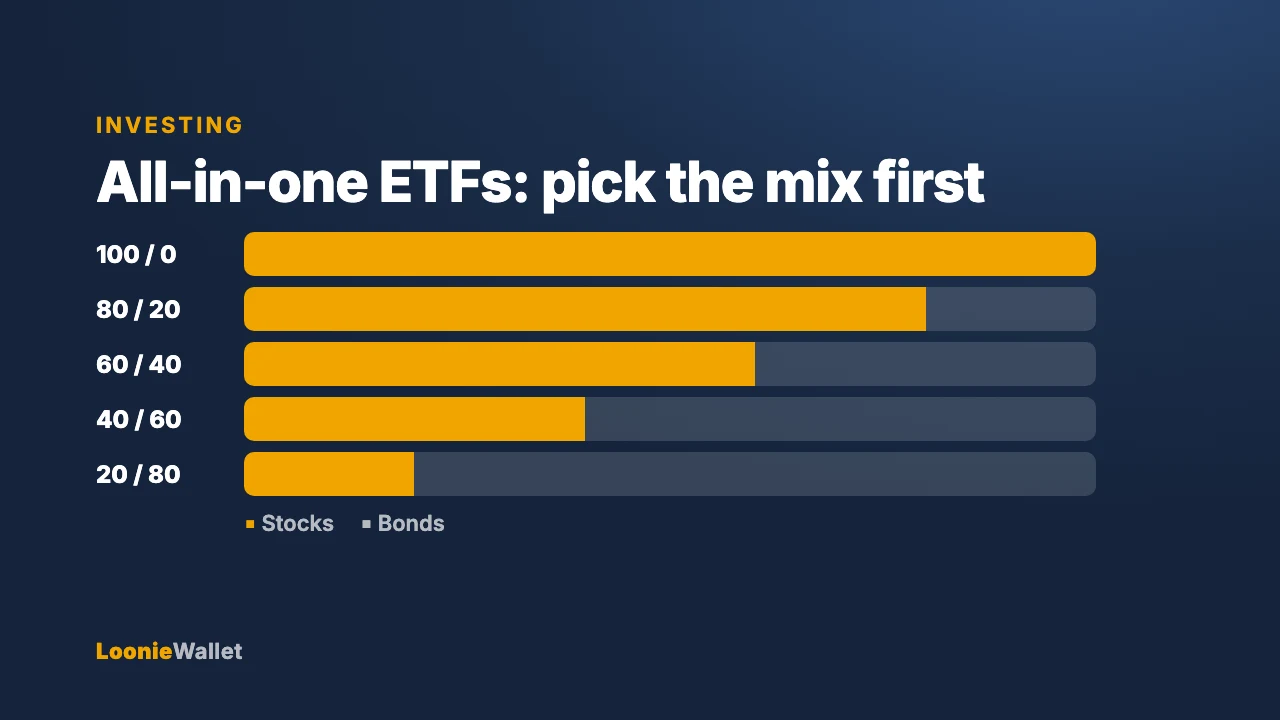
Whichever you pick, the decision that actually shapes your result is that you chose a 100% equity fund at all. Make sure that is right for your horizon; the all-in-one ETF guide walks through the 80/20 and 60/40 alternatives. And confirm which account it belongs in: TFSA vs RRSP settles that.
Frequently asked questions
Should I hold both? There is no diversification benefit; they hold the same markets. Holding both only makes sense if you already own one and want to switch new contributions without selling.
Is XEQT or VEQT better in a TFSA? Neither. The withholding-tax treatment is identical. Choose on the criteria above.
What about ZEQT or HEQT? BMO’s ZEQT charges a 0.15% management fee (cut in June 2025) and is structurally similar; its audited MER is 0.18% (BMO fact sheet, August 31, 2026). Global X’s HEQT and Fidelity’s FEQT exist too. None of them is a reason to switch out of XEQT or VEQT.
Why does VEQT list more stocks? FTSE’s all-cap indexes include more small companies than the S&P and MSCI IMI indexes iShares uses. The extra names are a tiny share of the fund.
Figures are from issuer documents as of the dates shown, reflect the time of writing, and can change without notice. Confirm current figures on the issuer’s website before you buy. This is education, not a recommendation to buy either fund.
About LoonieWallet
LoonieWallet is an independent resource created to help make smarter financial decisions. We research and publish fact-based guides, tutorials, and product reviews covering money transfers, fintech apps, and personal finance tools. Our mission is to make personal finance easier and clearer so readers can save time, money, and stress.
Read more about us here. If you have any questions, you can contact us using this page.
Sources
Checked on Sep 18, 2026 (iShares XEQT fact sheet (August 2026) and ETF Facts (June 2026); Vanguard VEQT fact sheet (August 31, 2026); management fees, MERs, holdings, allocations, distributions and calendar-year returns).
- iShares Core Equity ETF Portfolio (XEQT) fact sheet, August 2026 — BlackRock Asset Management Canada
- XEQT ETF Facts, June 19, 2026 — BlackRock Asset Management Canada
- Vanguard All-Equity ETF Portfolio (VEQT) fact sheet, August 31, 2026 — Vanguard Investments Canada
- Understanding foreign withholding tax: a reference guide — BlackRock Asset Management Canada