LoonieWallet Team · Investment · Last verified
All-in-One ETFs in Canada: How to Choose Between XEQT, VEQT, VGRO, XBAL and the Rest
One ticker, a whole portfolio, rebalanced for you. The choice that matters is your stock-to-bond mix, not the issuer. Every iShares, Vanguard and BMO asset-allocation ETF with verified fees, what actually differs between issuers, and a calculator for what the fee gap costs.
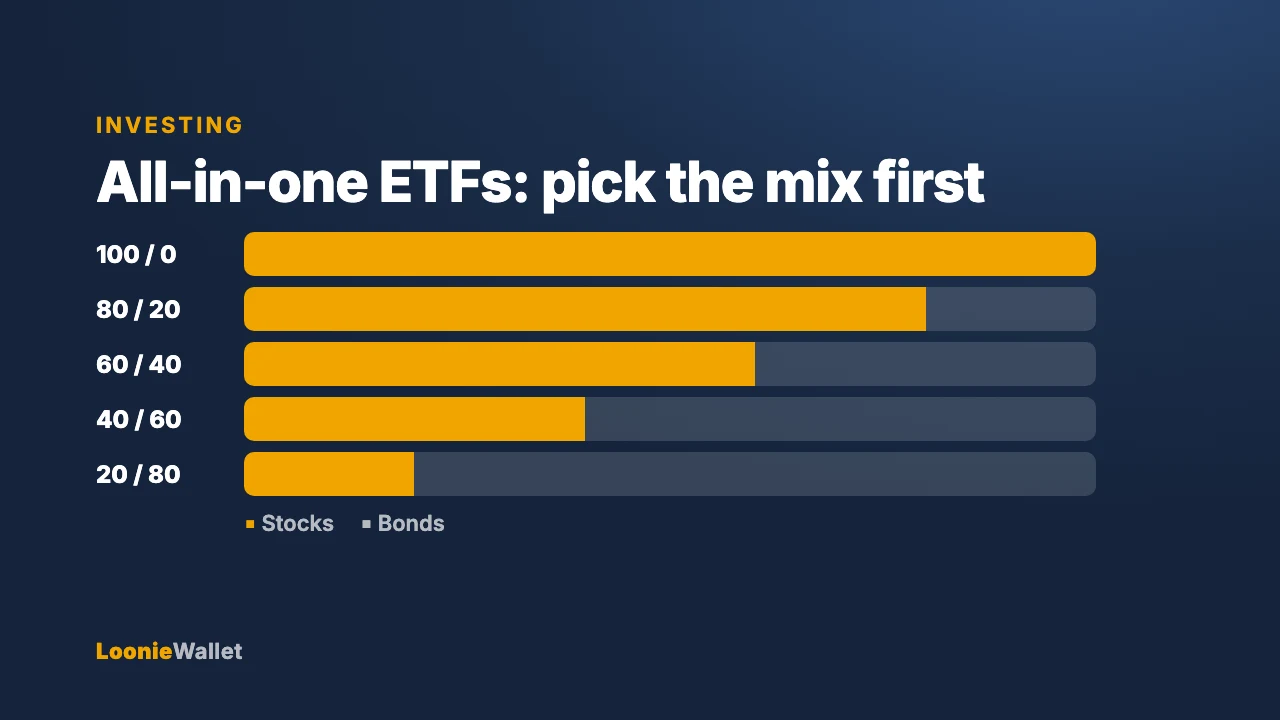
An all-in-one ETF (issuers call them asset-allocation ETFs) holds a complete, globally diversified portfolio of stocks and bonds inside one ticker and rebalances it for you. You pick the stock-to-bond mix once, buy the ticker, and keep buying it. For most Canadians investing on their own, this is the whole portfolio.
The decision has two parts, and they are not equally important. First, which mix. Second, which issuer. This guide takes them in that order, with the fees and allocations verified from issuer documents on 2026-09-18, and does not crown a “best” fund, because the best one depends on the first question.
Every all-in-one ETF from the three big issuers
Management fees were cut across the board in 2025: iShares to 0.17% (December 18, 2025), Vanguard to 0.17% (November 18, 2025), BMO to 0.15% (June 6, 2025). Reported MERs lag the cuts because they cover a trailing period, so the gaps below are already smaller than they look and should close further through 2026.
| Stock / bond mix | iShares | Vanguard | BMO |
|---|---|---|---|
| 100% stocks | XEQT MER 0.19% · $22.1B · quarterly distributions | VEQT MER 0.22% · $17.0B · annual distributions | ZEQT MER 0.18% · $995M · quarterly distributions |
| 80 / 20 | XGRO MER 0.20% · $4.6B · quarterly distributions | VGRO MER 0.22% · $10.8B · quarterly distributions | ZGRO MER 0.18% · $805M · quarterly distributions |
| 60 / 40 | XBAL MER 0.19% · $3.0B · quarterly distributions | VBAL MER 0.22% · $5.9B · quarterly distributions | ZBAL MER 0.18% · $668M · quarterly distributions |
| 40 / 60 | XCNS MER 0.18% · $435M · quarterly distributions | VCNS MER 0.22% · $965M · quarterly distributions | ZCON MER 0.18% · $119M · quarterly distributions |
| 20 / 80 | XINC MER 0.18% · $127M · quarterly distributions | VCIP MER 0.22% · $259M · quarterly distributions | — |
MER is the issuer’s most recently reported management expense ratio; net assets are as of the issuer’s latest published date (August 31, 2026 for XEQT, the Vanguard funds and the BMO funds; April 30, 2026 for XGRO and XBAL; September 17, 2026 for XCNS and XINC).
Fees, MERs, net assets and distribution details are as reported by each issuer at the time of writing and can change without notice. Issuers revise fees and publish new fact sheets throughout the year, so confirm current figures on the issuer’s website before you buy. This is general information, not personalized investment advice.
Other issuers sell the same idea (Global X, Fidelity, TD, Mackenzie, Horizons’ successor products). They are not in the table because their numbers were not verified for this article, not because they are worse.
Step 1: pick the mix, because it decides almost everything
Two funds with the same mix from different issuers will behave almost identically. Two funds from the same issuer with different mixes will not. XEQT lost 10.9% in 2022 and gained 24.7% in 2024; a 60/40 fund would have moved roughly half to two-thirds as far in each direction. The mix sets how much you can lose in a bad year, and that, not the return, is what makes people sell at the bottom.
| Mix | Suits | The trade-off |
|---|---|---|
| 100% stocks | Money you will not touch for 10+ years and a stomach for a 30% drop | Highest expected return, largest drawdowns |
| 80 / 20 | Long horizon, but you want the fall in a bad year to be smaller | Gives up some return for a smaller worst year |
| 60 / 40 | The classic balanced mix; 5 to 10 years, or a retiree drawing income | Gives up some return for a smaller worst year |
| 40 / 60 | Capital you may need in 3 to 7 years, or a cautious retiree | Bonds dominate; inflation is the main long-run risk |
| 20 / 80 | Mostly bonds; income with a small growth sleeve | Bonds dominate; inflation is the main long-run risk |
A practical test: take the equity share, multiply by 0.4, and ask whether you could see that fraction of your portfolio disappear on a statement without selling. A 100% stock fund means a 40% loss is a realistic scenario; 60/40 means roughly 25%. If the honest answer is no, pick the next rung down. Nothing about the fund choice fixes a mix you cannot hold through a crash.
If you are choosing between a TFSA, RRSP or FHSA at the same time, do that first: the TFSA vs RRSP rule and the FHSA guide decide where the money goes; this page decides what it buys once it is there.
Step 2: what actually differs between issuers
Once the mix is fixed, the remaining differences are small. They are real, so here they are in order of how much they matter.
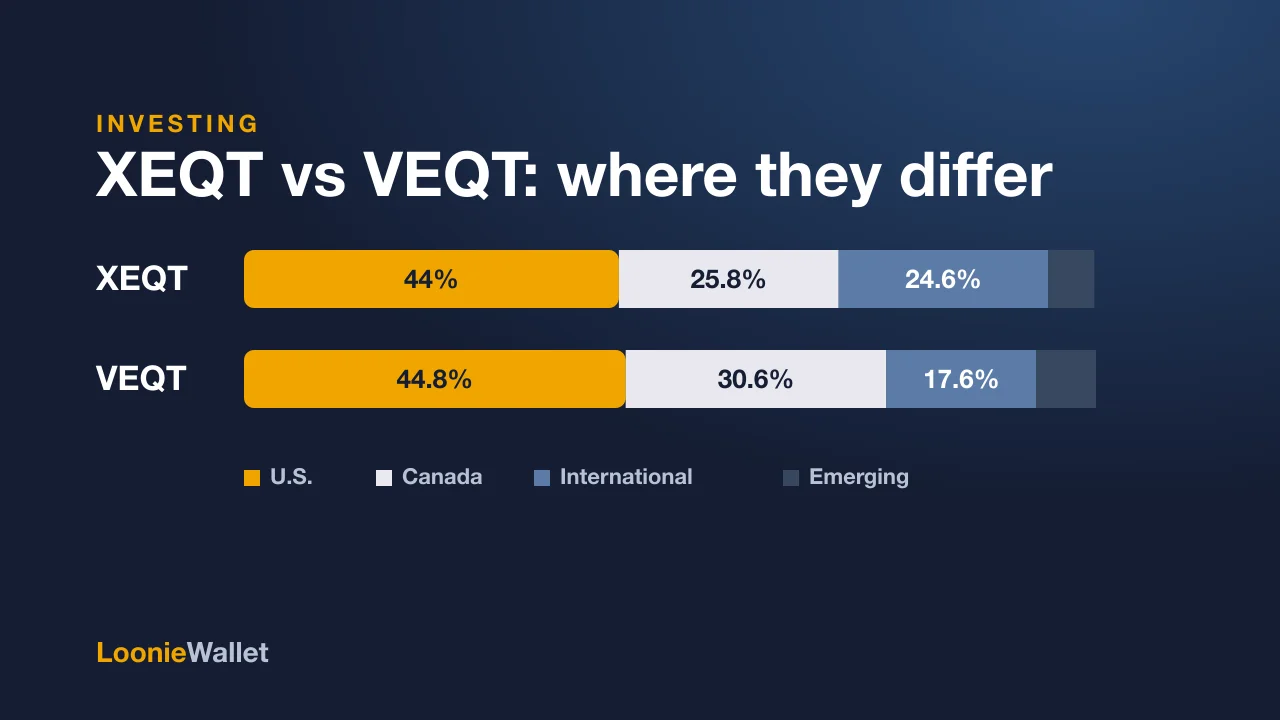
Home bias. Every Canadian all-in-one fund holds more Canada than Canada’s roughly 3% share of world stock markets, on purpose, for currency and tax reasons. iShares runs about 26% Canadian equity in XEQT; Vanguard runs about 31% in VEQT, with correspondingly less in the United States (44% versus 45%). Neither is right. The Vanguard weight is a bigger bet on Canada’s bank-and-resource-heavy market; the iShares weight is closer to the world. The XEQT vs VEQT comparison goes through this in detail.
Fees. After the 2025 cuts, the management fees are identical at iShares and Vanguard (0.17%) and lower at BMO (0.15%). Reported MERs are 0.19% to 0.20% at iShares, 0.22% at Vanguard and 0.18% at BMO. On a five-figure portfolio the difference is dollars a year; the calculator below shows what it becomes over decades.
Distributions. VEQT pays once a year; every other fund in the table pays quarterly. In a registered account this is cosmetic. In a taxable account it changes when you receive the income, not how much tax you pay.
Size and trading. All of the 100% and 80% funds are large enough that liquidity is not a concern. XEQT’s average bid-ask spread over the year to April 2026 was 0.03% per its ETF Facts. The smallest funds in the table (XINC, VCIP) are still hundreds of millions of dollars.
Bond sleeve. The balanced funds differ in how they build the bond side. VBAL, for example, splits bonds across Canadian, U.S. (hedged) and global ex-U.S. (hedged) aggregate indexes. These details rarely change the outcome for a long-term holder; read the fund facts if the bond side is most of your money.
What the fee gap costs
The largest MER gap in the table is between Vanguard’s reported 0.22% and iShares’ 0.19%. Enter your own numbers.
What the MER gap costs in dollars
XEQT ending value
VEQT ending value
Difference
Two things to keep in mind. The gap is shrinking as both issuers’ MERs catch up with the 2025 fee cuts. And a fee gap of a few basis points is smaller than the effect of a single year in which you sell in a panic, which is why the mix comes first.
The costs that are not in the MER
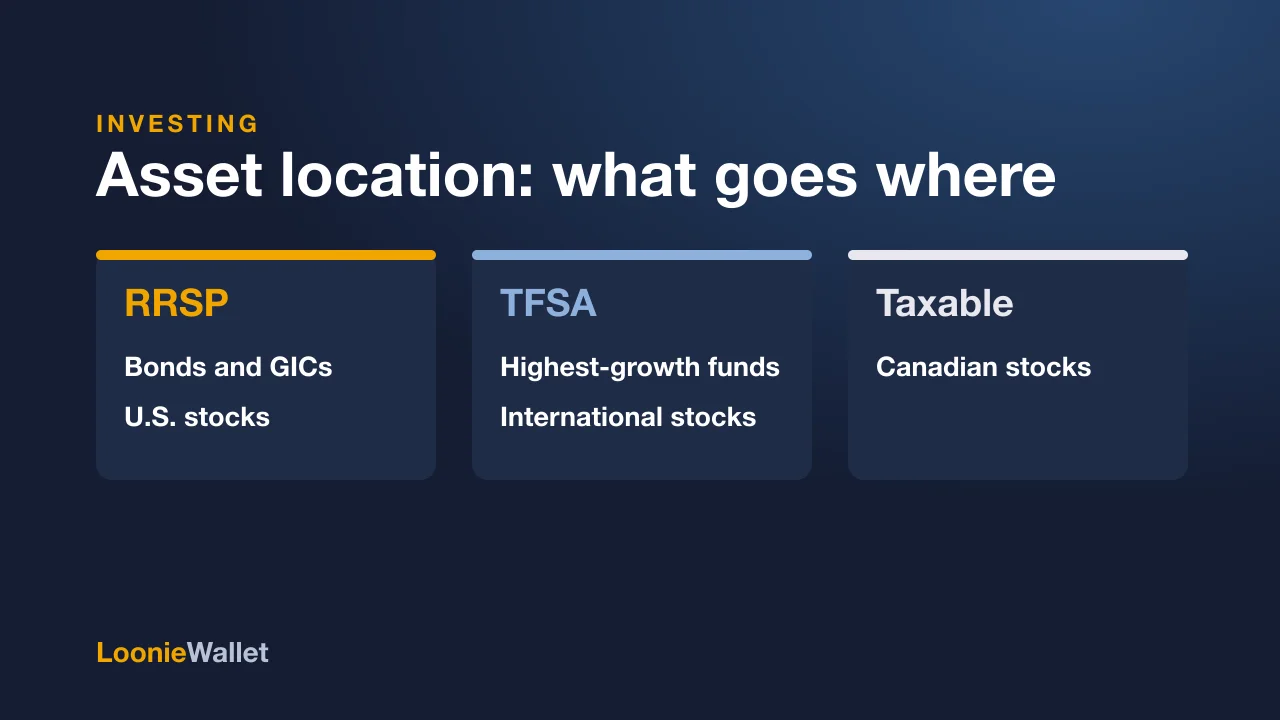
Foreign withholding tax. Every fund here reaches U.S. stocks either through a U.S.-listed ETF or a Canadian one, and the iShares reference guide is clear that both structures pay the 15% treaty rate on U.S. dividends inside a Canadian-listed fund, in every account type. In a TFSA or RRSP that tax is simply lost; in a taxable account it is generally creditable. At recent yields the drag is on the order of a tenth of a percent a year on the U.S. portion. It is the same for all of these funds, so it does not decide between them, but it does matter if you are choosing between an all-in-one fund and holding U.S.-listed ETFs directly in an RRSP. The asset location guide covers when that is worth the extra work.
The bid-ask spread and your broker. With the major brokerages now charging $0 commissions on ETFs, the spread is the trading cost. Buying with a limit order at the ask during regular hours keeps it to a few cents a unit.
Who should not buy one
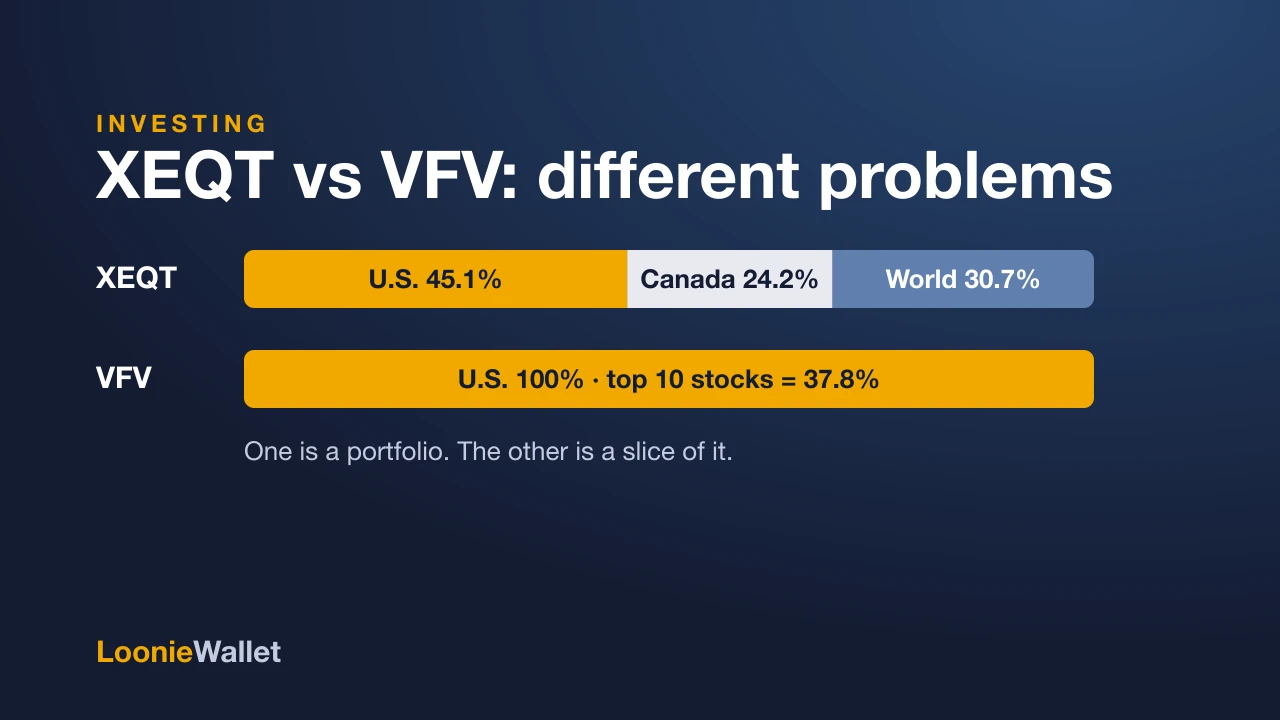
- You want to tilt. If you want more U.S. exposure than the fund gives, or a specific factor, an all-in-one fund fights you. XEQT vs VFV explains why adding an S&P 500 fund on top is a concentration bet rather than a diversification move.
- You have large taxable holdings with embedded gains. Switching into an all-in-one fund means realizing those gains. The fund is still a good destination for new money.
- You need a different mix in different accounts. All-in-one funds put bonds in every account. If you hold a taxable account and an RRSP, splitting bonds and stocks across accounts can be more tax-efficient. That is an asset location decision, and for most people the simplicity wins.
How to buy one
Open the account first (TFSA, RRSP or FHSA), then buy the ticker with a limit order. Wealthsimple, Qtrade and Questrade all charge $0 to buy and sell Canadian-listed ETFs as of 2026-09-18; the Wealthsimple vs Qtrade comparison covers what still differs. Set up a recurring purchase and stop looking.
Fund data on this page is from issuer documents as of the dates shown and changes monthly. This is education, not a recommendation to buy any security; the right mix depends on your horizon, other assets and tolerance for loss.
About LoonieWallet
LoonieWallet is an independent resource created to help make smarter financial decisions. We research and publish fact-based guides, tutorials, and product reviews covering money transfers, fintech apps, and personal finance tools. Our mission is to make personal finance easier and clearer so readers can save time, money, and stress.
Read more about us here. If you have any questions, you can contact us using this page.
Sources
Checked on Sep 18, 2026 (iShares, Vanguard and BMO fund facts, fact sheets and fee announcements; management fees, MERs, net assets, allocations and distribution schedules).
- iShares Core Equity ETF Portfolio (XEQT) fact sheet, August 2026 — BlackRock Asset Management Canada
- XEQT ETF Facts, June 19, 2026 — BlackRock Asset Management Canada
- Vanguard All-Equity ETF Portfolio (VEQT) fact sheet, August 31, 2026 — Vanguard Investments Canada
- Vanguard asset allocation ETF product pages (VGRO, VBAL, VCNS, VCIP) — Vanguard Investments Canada
- BMO lowers fees on asset allocation ETFs (June 2, 2025) — BMO Global Asset Management
- Understanding foreign withholding tax: a reference guide — BlackRock Asset Management Canada